
|
|
Earlier in this tutorial, you learned that corals are sensitive to temperatures warmer than the bleaching threshold; i.e., one degree Celsius (1 °C) above the highest summertime mean temperature, or Maximum Monthly Mean (MMM) sea surface temperature (SST) (Glynn and D'Croz, 1990). You also learned that NOAA CRW's daily global 5km satellite Coral Bleaching HotSpot product provides a snapshot of where corals and coral reefs are experiencing heat stress around the globe. Remember though that heat stress will build up if the temperature around the corals stays above the bleaching threshold over time. We need some way to measure not only how far the temperature is above the bleaching threshold, but also how long it has stayed above that point. This is what the daily global 5km satellite coral bleaching Degree Heating Week (DHW) product portrays. The DHW shows how much heat stress has accumulated in an area over the past 12 weeks (3 months). In other words, we add up the Coral Bleaching HotSpot values, over the last 12 weeks, whenever the SST reaches or exceeds the bleaching threshold. It is a running sum: as we advance one day at a time (a time step), a one-day time step "falls off" the back end of the 12-week window. Click here to learn more about how we calculate the DHW. **One important note**: since Glynn and D'Croz (1990) showed that temperatures exceeding 1 °C above the highest summertime mean temperature are sufficient to cause heat stress that can lead to coral bleaching, for the DHW calculation, NOAA CRW only accumulates Coral Bleaching HotSpot values that are equal to or greater than 1 °C. In other words, over the past 12 weeks, a HotSpot value is accumulated into the DHW calculation only when the SST reaches or exceeds the bleaching threshold (MMM + 1 °C). A HotSpot value is not accumulated on days when the SST is below this threshold. It is possible for a location to have a non-zero DHW value on a day when the HotSpot value is less than 1 °C or even 0 °C. This condition simply means that heat stress was present at that location within the last three months, but local conditions are not stressful for corals, on the day displayed in the corresponding DHW product map. Exposure to previous heat stress still may have had adverse impacts on the corals, although recovery also may be underway.
In the example daily global 5km satellite coral bleaching DHW product map displayed above, in the top right corner of this section,
light blue areas of the ocean have not accumulated heat stress over the previous 3 months. This means the SST in those areas
did not reach or exceed the bleaching threshold (MMM + 1 °C), and any Coral Bleaching HotSpots that may have been present were less than 1. All other
colored regions of the ocean indicate accumulated heat stress to corals in those areas; i.e., the Coral Bleaching HotSpot is ≥ 1, and the The units for DHW are "degree Celsius-weeks" (or °C-weeks), combining the intensity and duration of the oceanic heat stress into one single number. In-water field observations around the world, from both professional scientific surveys and informal monitoring reports, have indicated that by the time the accumulated heat stress (the DHW) reaches 4 °C-weeks, you can expect to see coral bleaching reef-wide, especially in more sensitive coral species. By the time the DHW value reaches 8 °C-weeks or higher, you are likely to see reef-wide coral bleaching with mortality of heat-sensitive corals. Let's look again at the example two-year (2019-2020) time series graph for the Main Hawaiian Islands 5km Regional Virtual Station, so we can better visualize the DHW concept with data. In the graph below, the DHW accumulates any time the 5km SST (dark bluish-purple solid line) touches or exceeds the bleaching threshold temperature (light blue, horizontal solid line). So, in the magnified box below, we add up the areas (Coral Bleaching HotSpots ≥ 1) highlighted in red to calculate/create the 5km DHW. 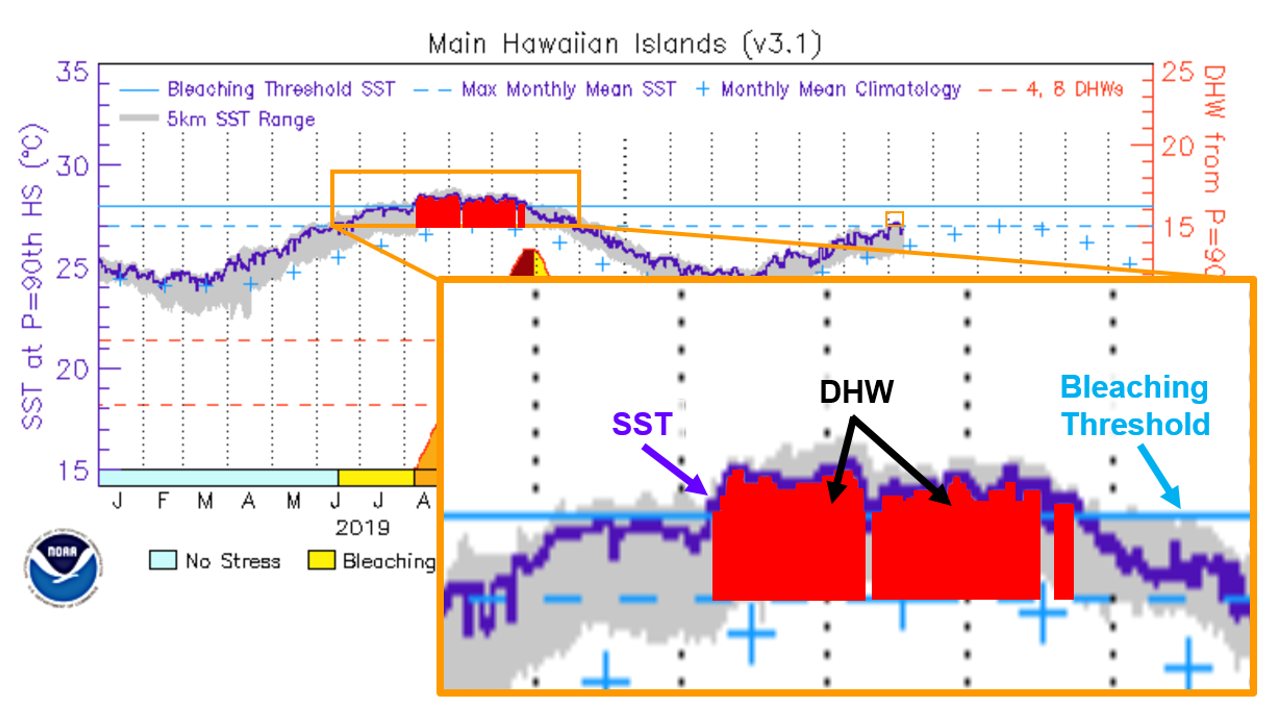
Additionally, in each time series graph, the 5km DHW is plotted along the bottom of the graph (as a red solid trace), with the DHW scale (in °C-weeks) on the right-hand axis. The original 4 and 8 °C-weeks DHW thresholds are shown as red, horizontal dashed lines on the graph. The colors that fill below the DHW trace correspond to the original Bleaching Alert Area heat stress levels (which we will discuss in the next tutorial section) that spanned from No Stress to Bleaching Alert Level 2 only. The Bleaching Alert Area product was refined in December 2023, to add new Bleaching Alert Levels 3-5, in response to extreme accumulations of bleaching-level heat stress on coral reefs in the Atlantic Ocean, eastern Tropical Pacific, and in other regions in 2023. 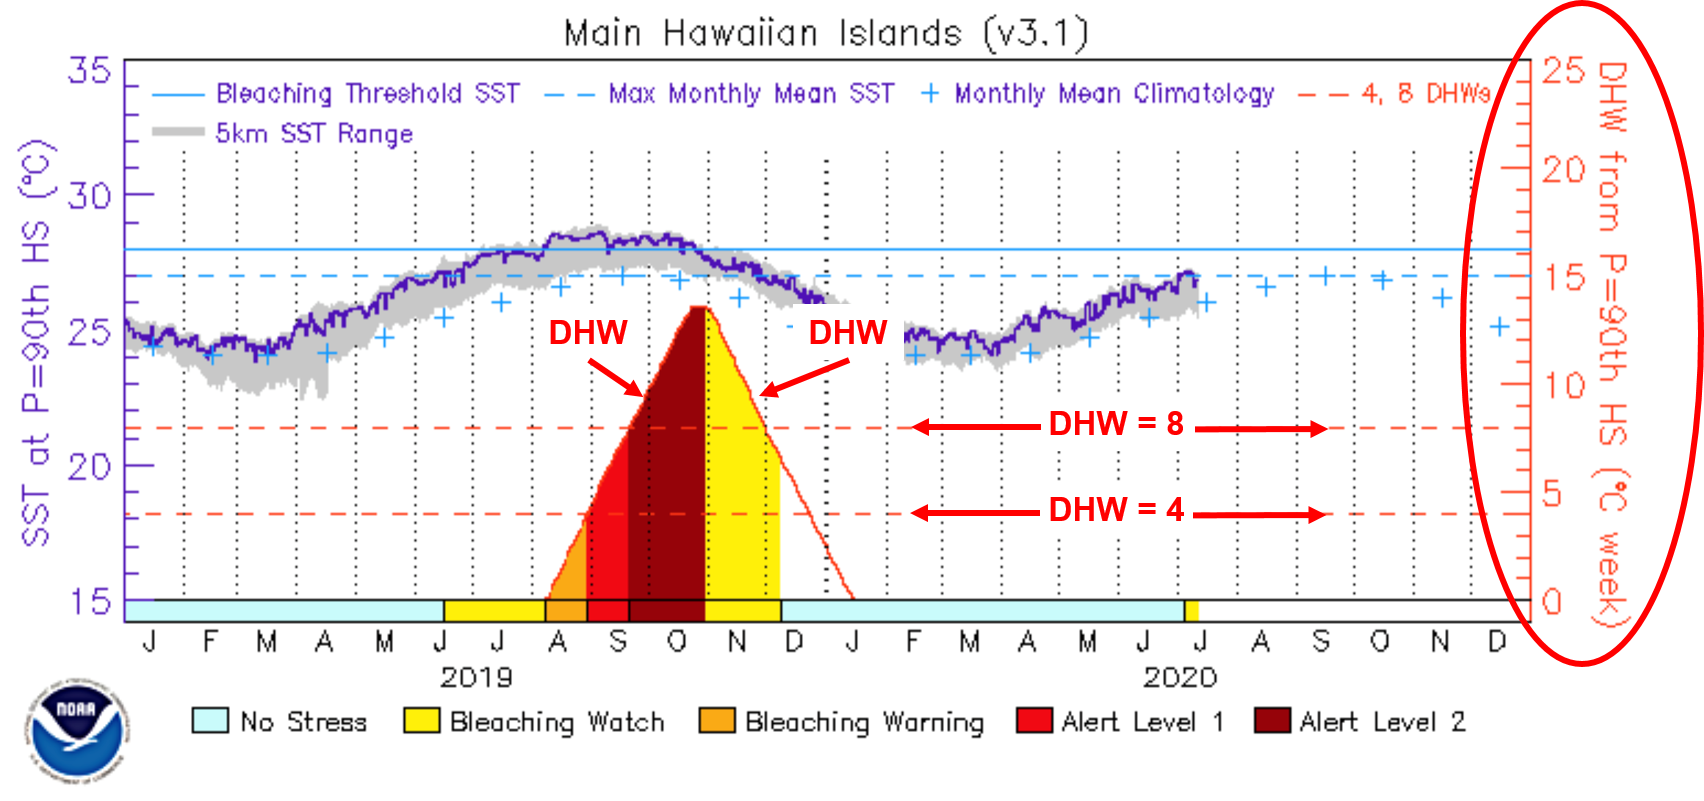
|
|||||||||||||||
|
|
||||||||||||||||