


|
|
The "bleaching threshold" concept is crucial for understanding the NOAA CRW products, and we find that it is often misunderstood. This entire section will focus, therefore, on a careful definition of this concept, before we delve further into additional daily 5km satellite coral bleaching heat stress monitoring products. You will remember from the Coral Bleaching section that corals are very sensitive to heat stress from warmer-than-usual temperatures. To identify coral reef areas around the world that are at risk for bleaching, we first look for locations that are warmer than normal; i.e., places with a positive Sea Surface Temperature (SST) Anomaly. Since corals start to become stressed and bleach when the SST is 1 °C warmer than the highest monthly mean temperature (Glynn and D'Croz, 1990), we next hone in on those locations, where the SST is above the Maximum Monthly Mean (or MMM) SST for that location. Let’s look again at the example two-year (2019-2020) time series graph for the Main Hawaiian Islands 5km Regional Virtual Station, so we can better visualize the MMM concept with data. In the previous section, we mentioned that the light blue crosses on a NOAA CRW time series graph represent the Monthly Mean Climatology temperatures for the 5km Regional Virtual Station being displayed. Now we need to look for the warmest month in the seasonal cycle at that coral reef region/area. For the Main Hawaiian Islands 5km Regional Virtual Station, the maximum temperature within the Monthly Mean Climatology is 27 °C. This is reached in September. So for the Main Hawaiian Islands 5km Regional Virtual Station, the Maximum Monthly Mean (MMM) SST is 27 °C -- shown as a light blue, horizontal dashed line on the time series graph. 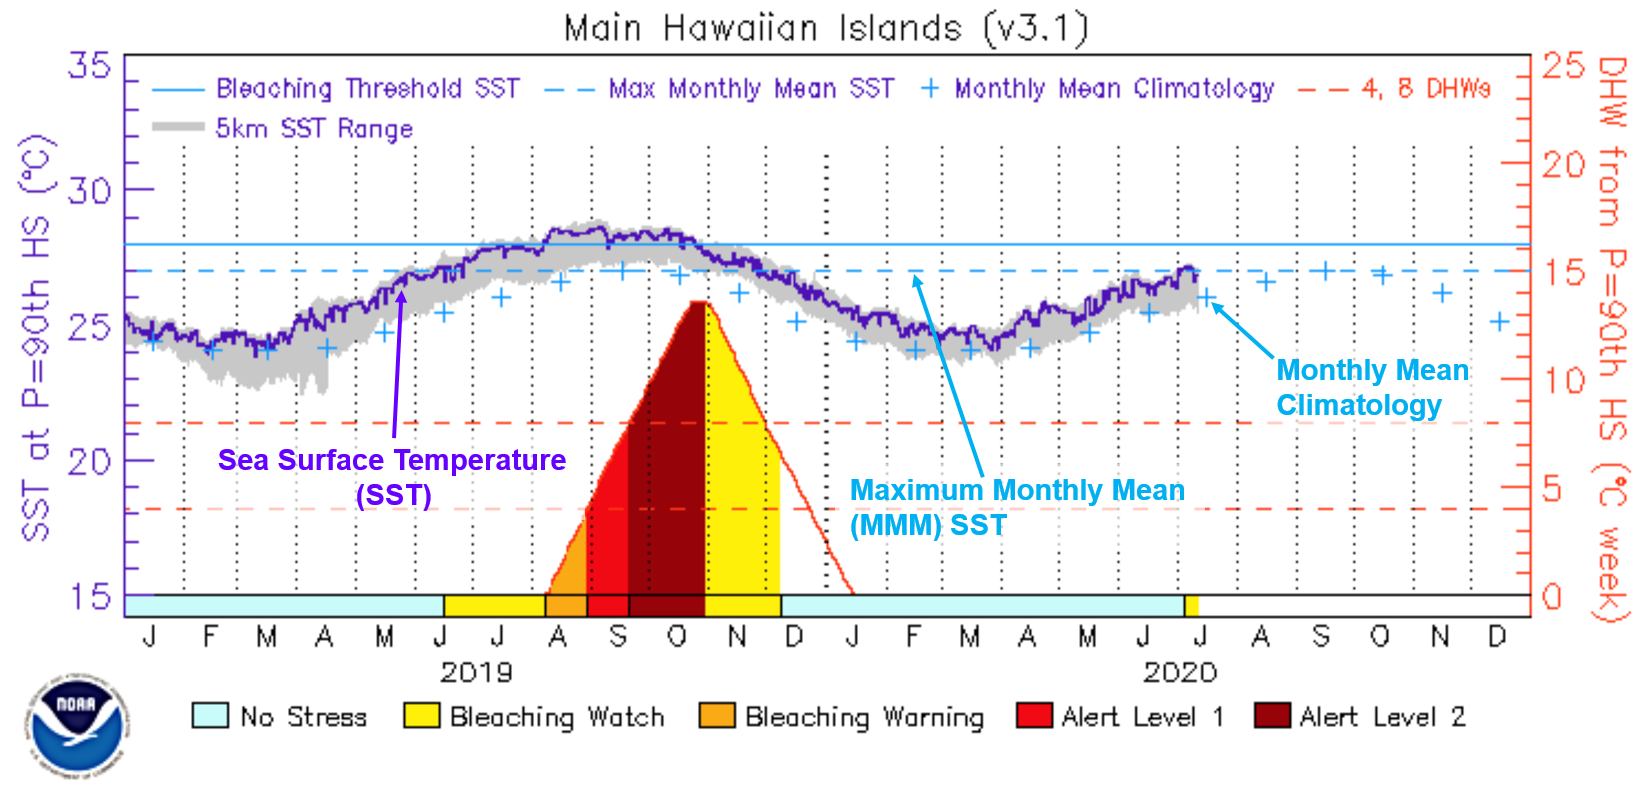
One degree Celsius (1 °C) above the MMM is called the "bleaching threshold" temperature. The bleaching threshold SST is shown on the NOAA CRW time series graph as a light blue, horizontal solid line. In the example time series graph for the Main Hawaiian Islands 5km Regional Virtual Station, the bleaching threshold SST is 28 °C. 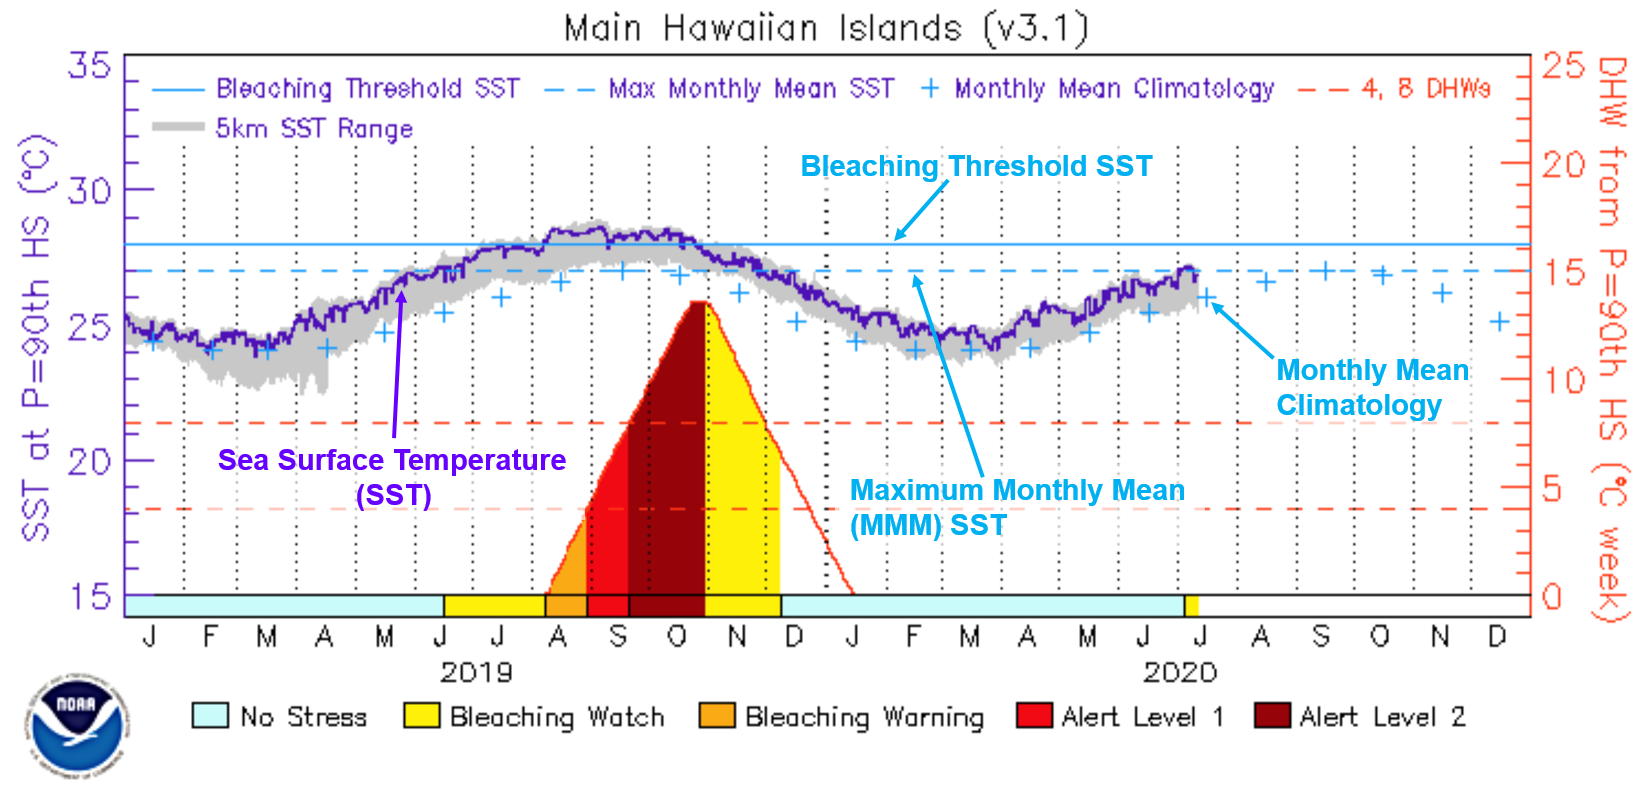
When the SST reaches or exceeds the bleaching threshold temperature, corals experience heat stress and begin to bleach. If the SST increases substantially above the bleaching threshold, and/or stays above the bleaching threshold for an extended period of time, significant coral bleaching can occur over a large area of a reef. We call this mass coral bleaching. If the mass coral bleaching persists or intensifies further, entire coral reefs can die.
|
||||||||||
|
|
|||||||||||