
|
November 13, 2025 (updated early-month)
Alert Status:
La Niña Advisory
(definitions)
La Niña is favored to continue into the Northern Hemisphere winter,
with a transition to ENSO-neutral most likely in January-March 2026 (61%
chance)
DIAGNOSTIC DISCUSSION:
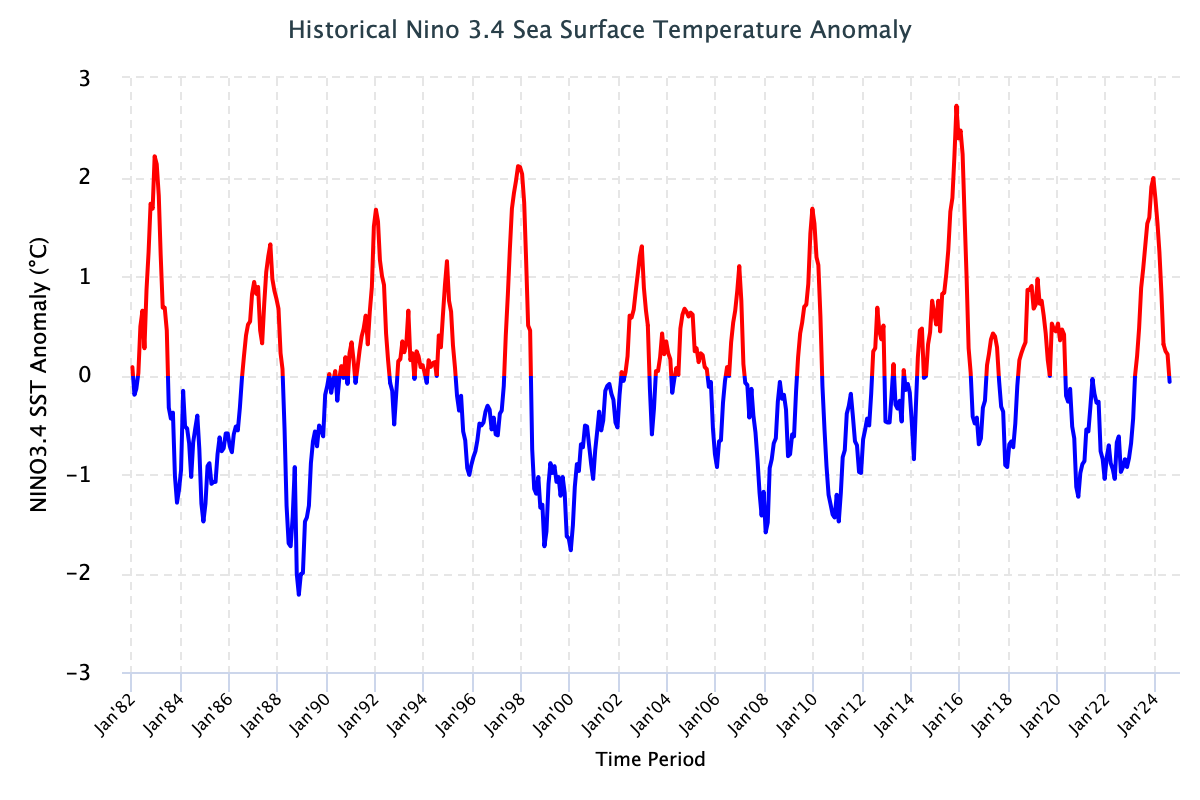
La Niña continued over the past month, as indicated by the strengthening
of below-average sea surface temperatures (SSTs) across the
central
and eastern equatorial Pacific Ocean. The
latest
weekly Niño indices were between -0.5°C and -0.7°C,
with the
exception
of the easternmost Niño-1+2 index at -0.2°C. Negative
subsurface
temperature anomalies persisted (averaged from 180°-100°W), with
below-average
temperatures prevailing from the surface to 200m depth in the eastern half of the equatorial Pacific.
The atmosphere continued to reflect La Niña, with low-level easterly
wind anomalies and upper-level westerly wind anomalies observed across most
of the equatorial Pacific Ocean.
Enhanced
convection persisted over Indonesia and was weakly suppressed near the Date Line.
Both the traditional and equatorial Southern Oscillation indices were positive.
Collectively, the coupled ocean-atmosphere system reflected La Niña.
Last month, the
IRI
multi-model predictions favored La Niña to continue through
December-February (DJF) 2025-26. While also considering predictions from
the North American Multi-Model Ensemble, the ENSO team believes uncertainty
for the DJF season is high with La Niña (51% chance) slightly favored
over ENSO-neutral (48% chance). La Niña is expected to remain weak
(3-month average Niño-3.4 index value at or between -0.5°C and -0.9°C).
A weak La Niña would be less likely to result in conventional winter
impacts, though predictable signals could still influence the forecast guidance
(e.g.,
CPC's seasonal outlooks).
... Read more at the
NOAA's Diagnostic Discussion![]() ,
CPC ENSO Update
,
CPC ENSO Update![]() , and
CPC's Official Probabilistic ENSO Forecast
, and
CPC's Official Probabilistic ENSO Forecast![]() sites,
all updated at the same time in the early-month.
sites,
all updated at the same time in the early-month.
** Note: IRI's Monthly Ouick Look![]() updates twice
per month and presents the latest update between the (I) early-month CPC official Probabilistic
Forecast (shown in this section) and (II) mid-month IRI Model-Based Probabilistic Forecast
(shown in the following two sections).
updates twice
per month and presents the latest update between the (I) early-month CPC official Probabilistic
Forecast (shown in this section) and (II) mid-month IRI Model-Based Probabilistic Forecast
(shown in the following two sections).
(The update of the CPC ENSO diagnostics discussion and forecast is scheduled
for the second Thursday of each month.)
|
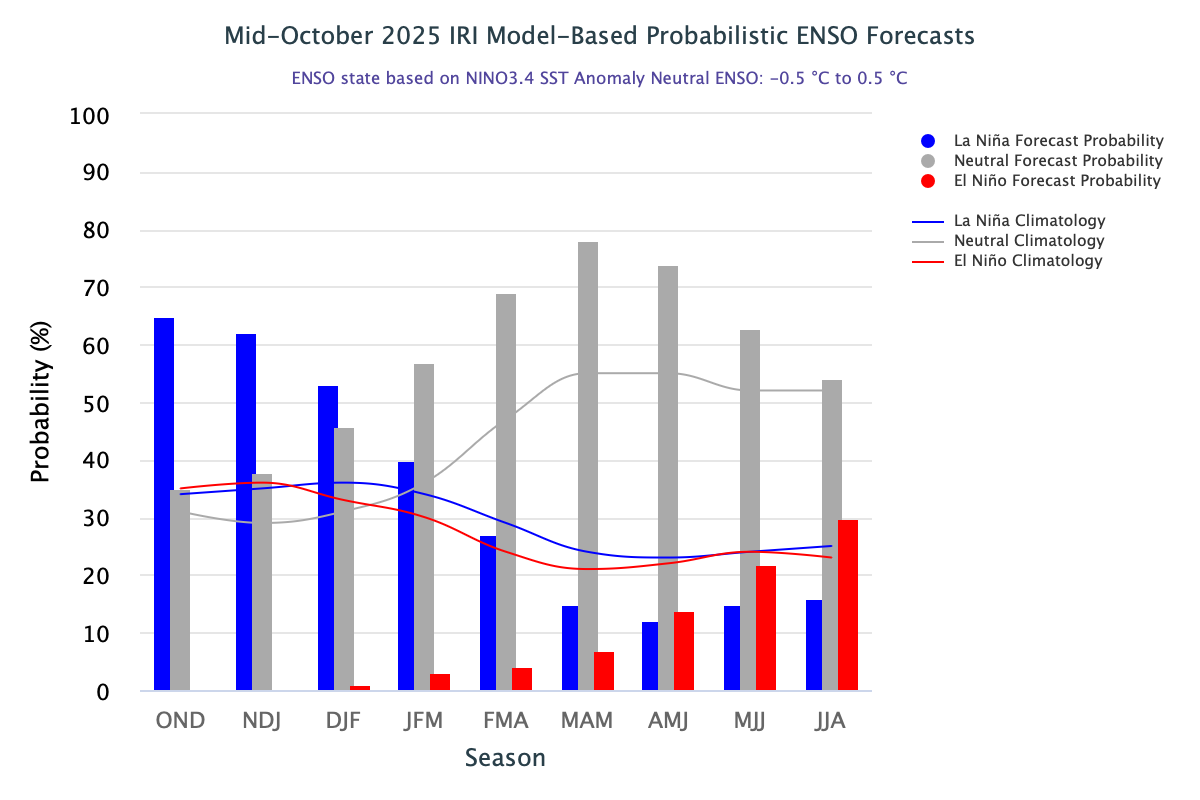
November 19, 2025 (updated mid-month)
The probability of La Niña has been predicted to be at 67% for
November–January, easing to 53% for December–February 2025/26.
As of mid-November 2025, the equatorial Pacific is in a La Niña state,
with sea surface temperatures in the Niño 3.4 region hovering near the
La Niña threshold and continuing a gradual cooling trend.
The IRI ENSO
plume forecast
places the probability of La Niña at 67% for November–January, easing
to 53% for December–February 2025/26. From January–March onward, conditions
begin shifting toward ENSO-neutral, which becomes the dominant outlook.
Neutral probabilities rise to 63% at the start of the year and remain the
leading state through the forecast period ending in July–September 2026.
El Niño probabilities stay very low—below 10%—through March–May 2026,
but gradually increase thereafter, reaching 16% in April–June, 27% in May–July,
32% in June–August, and 35% by July–September 2026.
... Read more at the
IRI Technical ENSO Update![]() ,
IRI Model-Based Probabilistic ENSO Forecast
,
IRI Model-Based Probabilistic ENSO Forecast![]() ,
IRI ENSO Predictions Plume
,
IRI ENSO Predictions Plume![]() , and
IRI Forecast Probability Distribution Based on the IRI ENSO Prediction
Plume
, and
IRI Forecast Probability Distribution Based on the IRI ENSO Prediction
Plume![]() sites, all updated at the same time in the mid-month.
sites, all updated at the same time in the mid-month.
** Note: IRI's Monthly Ouick Look![]() updates twice
per month and presents the latest update between the (I) early-month CPC official Probabilistic
Forecast (shown in this section) and (II) mid-month IRI Model-Based Probabilistic Forecast
(shown in the following two sections).
updates twice
per month and presents the latest update between the (I) early-month CPC official Probabilistic
Forecast (shown in this section) and (II) mid-month IRI Model-Based Probabilistic Forecast
(shown in the following two sections).
(The update of the IRI ENSO forecast is scheduled for the 19th of each month. If the 19th falls on a weekend or holiday, it is released on the closest business day.)
November 19, 2025 (updated mid-month)
|
|
... Read more
here![]() , where
any specific model can be interactively examined, along with other detailed information.
, where
any specific model can be interactively examined, along with other detailed information.
(The update of the IRI ENSO forecast is scheduled for the 19th of each month. If the 19th falls on a weekend or holiday, it is released on the closest business day.)
|
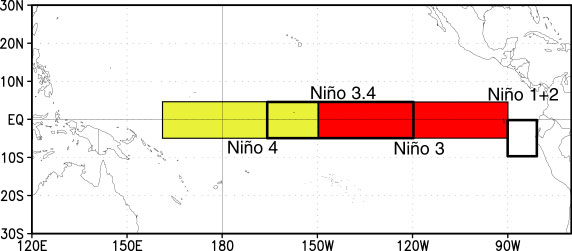
Ocean Niño Index (ONI) - NOAA's primary indicator for monitoring ENSO:
Journal Article: A Relative Sea Surface Temperature Index for Classifying ENSO Events![]()
NOAA CPC's El Niño - Southern Oscillation (ENSO) resources webpage
El Niño Regions:
El Niño and La Niña events tend to develop during the period Apr-Jun and they
The spring predictability barrier: Forecasts made at some times of the year generally have higher skill than forecasts made at other times of the year -- namely, they are better when made between June and December than when they are made between February and May. This is a well-known challenge for forecaster and it can impact statistical models more than dynamical models.
The content posted on this web page solely represents the opinions of the authors and does not constitute a statement of policy, decision, or position on behalf of NOAA or the US Government.
The appearance of external links on this World Wide Web site does not constitute endorsement by the Department of Commerce/National Oceanic and Atmospheric Administration of external Web sites or the information, products or services contained therein. For other than authorized activities, the Department of Commerce/NOAA does not exercise any editorial control over the information you may find at these locations. These links are provided consistent with the stated purpose of this Department of Commerce/NOAA Web site.