


(Version 1.0, released on 10 May 2018)
| Product: | | | Map Extent: |
| Year: | | | Month: | | | Day: | | |
Access data via HTTPS: Puerto Rico Ocean Color Data (NetCDF)
Access data via FTP: Puerto Rico Ocean Color Data (NetCDF)

Time Range:
|
Product:
|
Virtual Area:
|
Virtual Area Data (Text): Time Series Data
VIIRS Ocean Color Monitoring Product Description
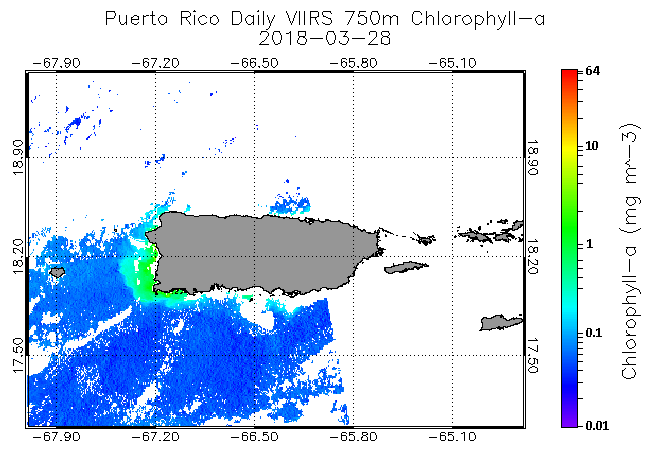
NOAA Coral Reef Watch and NOAA/NOAA/National Environmental Satellite, Data, and Information Service (NESDIS) Ocean Color Team are working closely with partners in the U.S. Coral Reef Task Force (USCRTF) Watershed Working Group (WWG) to develop satellite ocean color products for use over coral reefs. Data are from the Visible Infrared Imaging Radiometer Suite (VIIRS) onboard the Suomi National Polar-orbiting Partnership (S-NPP) satellite operated by the NOAA Joint Polar Satellite System (JPSS).
NOAA and the USCRTF have identified Land-Based Sources of Pollution (LBSP) as one of the three major threats to coral reef ecosystem health. LBSP is typically caused by coastal and upstream land development and is identifiable by a significant increase in water turbidity, especially following large precipitation events. The experimental VIIRS satellite ocean color products presented here are designed to help coral reef ecosystem and watershed managers monitor variable water turbidity and phytoplankton biomass. The two VIIRS products related to these physical parameters are, respectively, the diffuse attenuation coefficient at 490nm, Kd(490) (m-1), and chlorophyll-a concentration (mg m-3). Anomalously high values of Kd(490) are often related to runoff from land, usually after heavy precipitation events or from industrial or residential discharges, and resuspension of sediment. Anomalously high concentrations of chlorophyll-a are often related to high nutrient input events.
NOAA Coral Reef Watch is developing VIIRS satellite ocean color products for two high priority watershed sites adjacent to coastal coral reefs, identified by the USCRTF WWG. Presented here are the products for Guánica Bay, Puerto Rico. The spatial resolution of the VIIRS data used for deriving these images is 750m, and images are updated daily at 09:00 ET. There is a delay of 15 calendar days in image production (meaning the “Current Date” displayed is actually for 15 days ago). This is because the data are “science quality”, which means a given day of data is derived and quality controlled using 15 days of past and future data relative to that date. For ocean color data from polar-orbiting satellites, the time window in the past and future used to create "science quality" data is 15 days; this ensures data availability in instances of frequent data loss from clouds.
Data and imagery are available from January 2, 2012 to the present. Data are accessible in NetCDF format by clicking the Puerto Rico Ocean Color Data link under the map above.
The map image (top of page) can be displayed for three spatial extents: Puerto Rico, La Parguera, and Northeast PR. Available VIIRS ocean color products include chlorophyll-a (as daily, 3-day, and 8-day rolling averages), Kd(490) (as daily, 3-day, and 8-day rolling averages), and chlorophyll-a anomaly (following Stumpf et al. 2003)1. Due to frequent satellite data loss from cloud cover in Puerto Rico, some daily images may appear completely white (i.e., they have no supporting satellite data) for a given map extent. The 3- and 8-day rolling averages help fill these data gaps and capture ocean color dynamics that may have occurred during these times. While this increases data cover, it also can smooth out locally significant events.
Two-year time series graphs of the 750m VIIRS satellite ocean color data (middle of page) are available for three, pre-defined Virtual Areas for the island of Puerto Rico, as suggested by local watershed and coral reef managers: Guánica Bay, La Parguera, and Cabo Rojo. A Virtual Area is a selection of satellite data pixels over important coastal habitat influenced by a known watershed or other municipal boundary. The extent of each Virtual Area was determined by a data coverage analysis to capture the most data available from VIIRS while maintaining geographic specificity to an area of interest. Click on the "Show Virtual Area Extent On Map" button below the time series graph to view the boundaries of each Virtual Area on the map image at the top of the page. The two-year time series graphs are available from 2012 to the present and can be toggled to display daily or monthly maximum values of Kd(490) or chlorophyll-a within each Virtual Area. The 750m VIIRS data corresponding to the daily and monthly maximum values each month since January 2012, in each Virtual Area, are available as text files by clicking the "Time Series Data" link below the graph.
Time Series Data file header definitions:
YYYY – Year
MM – Month
DD – Day of month (daily data only)
DAY_OF_MAX_CHLA – Day of the corresponding month when the maximum chlorophyll-a value occurred (monthly data only)
CHLA_MAX – Maximum value of chlorophyll-a concentration within the Virtual Area (daily or monthly data)
CHLA_MAX_IND_X – Column index within the data file where the maximum chlorophyll-a value occurred
CHLA_MAX_IND_Y – Row index within the data file where the maximum chlorophyll-a value occurred
CHLA_MEAN – Mean value of chlorophyll-a concentration within the Virtual Area (daily or monthly data)
DAY_OF_MAX_KD490 – Day of the corresponding month when the maximum Kd(490) value occurred (monthly data only)
KD490_MAX – Maximum value of Kd(490) within the Virtual Area (daily or monthly data)
KD490_MAX_IND_X – Column index within the data file where the maximum Kd(490) value occurred
KD490_MAX_IND_Y – Row index within the data file where the maximum Kd(490) value occurred
KD490_MEAN – Mean value of Kd(490) within the Virtual Area (daily or monthly data)
Support for the development of the VIIRS satellite ocean color products has been provided by the NOAA Ocean Remote Sensing Program and the NOAA Coral Reef Conservation Program.
1R.P. Stumpf, M.E. Culver, P.A. Tester, M. Tomlinson, G.J, Kirkpatrick, B.A. Pederson, E. Truby, V. Ransibrahmanakul, M. Soracoo (2003). Monitoring Karenia brevis blooms in the Gulf of Mexico using satellite ocean color imagery and other data. Harmful Algae 2(2):147-160.