


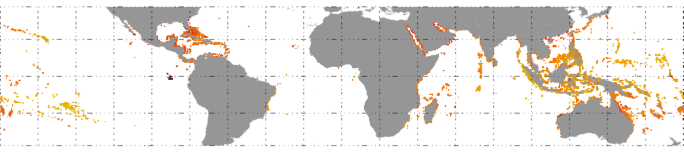
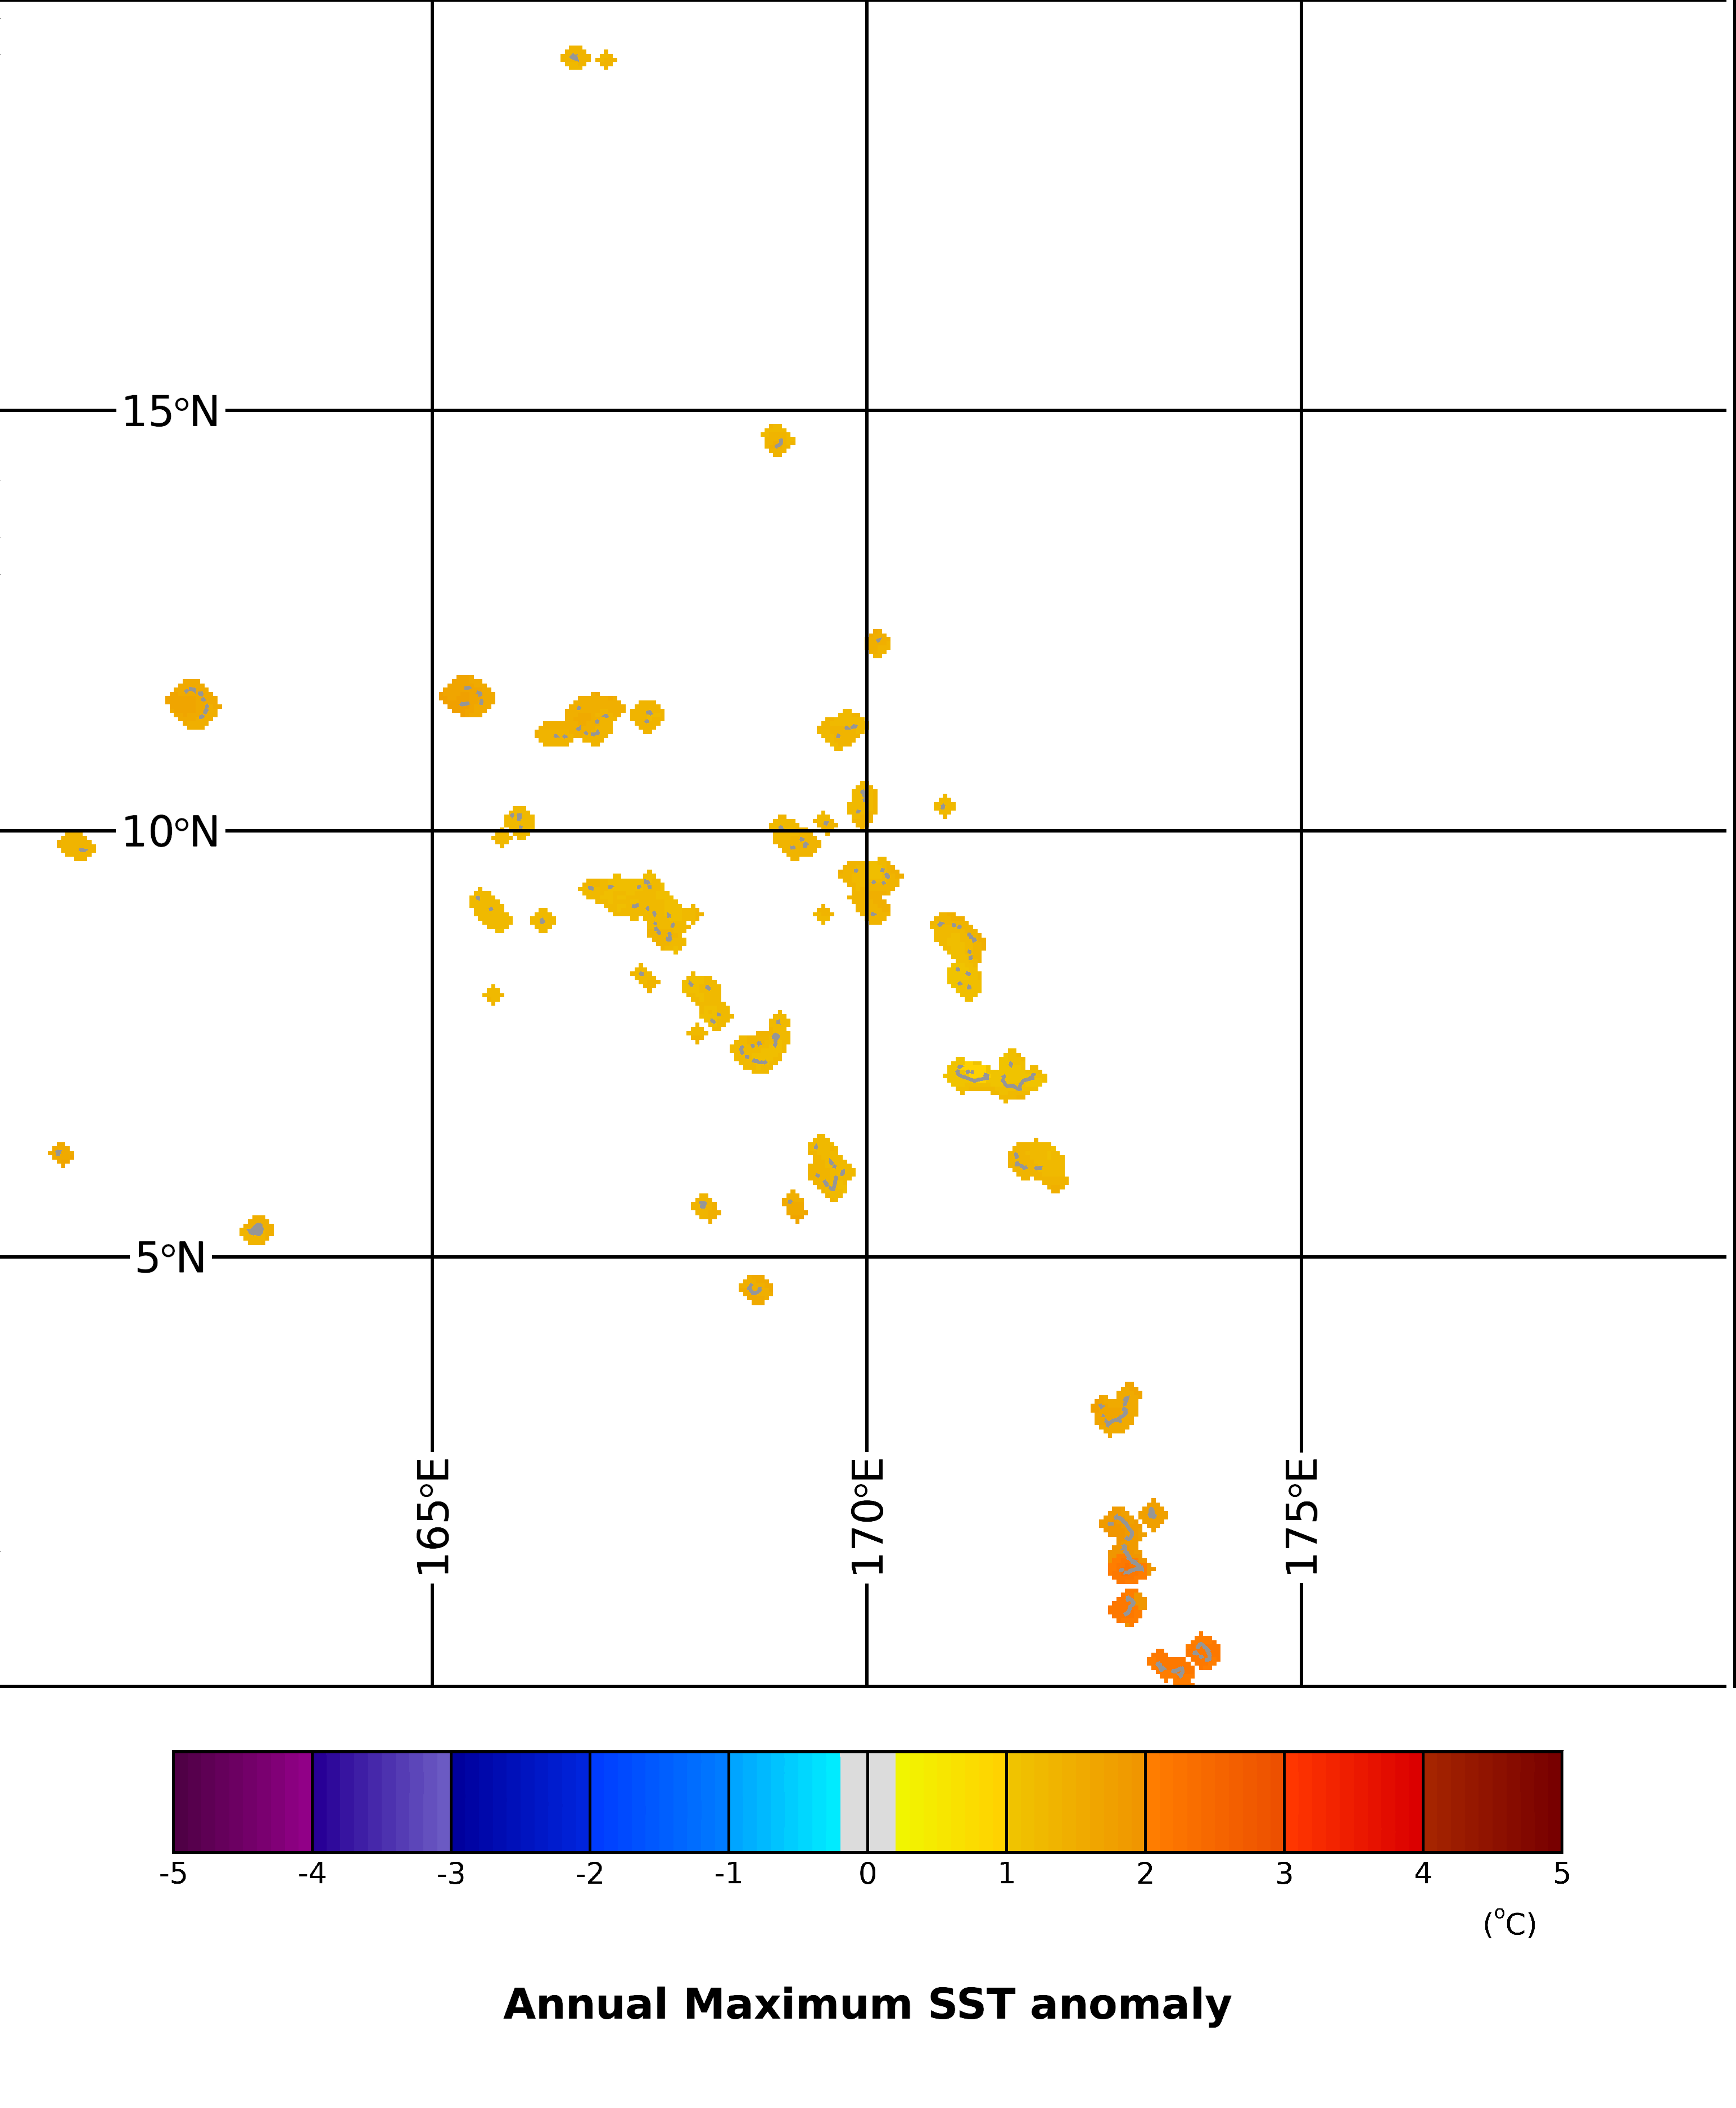
Thermal History - Annual Maximum SST Anomaly (1985-2023)
(Version 3.5, released January 31, 2024)
(Version 3.5, released January 31, 2024)
(Click on a location in the global map to see its regional map below.)
Select a year:
Thermal History Products:
Home | Stress Frequency | Stress Onset | SST Variability | SST Trend | Climatology | Annual History
Home | Stress Frequency | Stress Onset | SST Variability | SST Trend | Climatology | Annual History
Download data (netCDF):
HTTPS site
Stress Frequency (401Mb) | Stress Onset (401Mb) | SST Variability (248Mb) | SST Trend (134Mb)
Climatology (592Mb) | Annual History (7.3Gb)
HTTPS site
Stress Frequency (401Mb) | Stress Onset (401Mb) | SST Variability (248Mb) | SST Trend (134Mb)
Climatology (592Mb) | Annual History (7.3Gb)
FTP site
Stress Frequency (401Mb) |
Stress Onset (401Mb) |
SST Variability (248Mb) |
SST Trend (134Mb)
Climatology (592Mb) |
Annual History (7.3Gb)
Product Metadata (for the Version 3.1.0 product):
Web-format Metadata | XML Metadata | Plain Text Metadata
Web-format Metadata | XML Metadata | Plain Text Metadata
Product Description
Annual Maximum Sea Surface Temperature (SST) Anomaly: For each year during 1985-2023, at each location, we provide the greatest SST Anomaly (i.e., the departure from the expected SST value at each location for that time of year, as derived from the Monthly Climatology). Values are derived using the Version 3.1 daily global 5km CoralTemp satellite SST data product.