

Description for Satellite Virtual Station Time Series Graphs
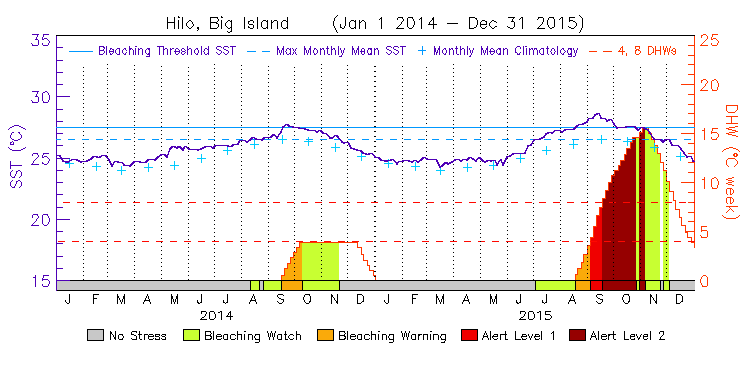

Coral Reef Watch (CRW) Satellite Virtual Station time series graphs display the sea surface temperature (SST) and Coral Bleaching Degree Heating Weeks (DHW) at each of CRW's Virtual Stations from December 2000 to the present. Currently, two types of graphs are provided: two-year graphs (click on the sample graph on the left, above) and multi-year graphs (click on the sample graph on the right, above). Both sets of the graphs were created from the same data accessible from CRW's Virtual Stations web page. The multi-year graphs provide a convenient way to compare the time series among years, while recent SST and DHW variations can be examined easily on the two-year graphs. These graphs and corresponding data (accessible from the Virtual Station web pages) depict the historical record of SST and coral bleaching thermal stress measurements at each Virtual Station.
SST is shown in the center of graphs and read using the vertical axis on the left. DHW is shown in the bottom portion of the graphs and read using the vertical axis on the right. In the multi-year graphs, SST and DHW time series for the current year are plotted in thick black solid lines; the past two years are plotted in thin black and thin gray lines to make them distinguishable from all other years. When the DHW values is zero, no DHW time series is plotted.
The coral bleaching thermal stress level (or alert level) is color-coded and plotted along the horizontal axis. On the multi-year graphs, the coral bleaching thermal stress level is plotted for the current year only. Bleaching thermal stress is categorized into five bleaching risk levels (defined below) based on Coral Bleaching HotSpot and Degree Heating Week values experienced at the Virtual Stations.
|
Stress Level No Stress Bleaching Watch Bleaching Warning Bleaching Alert Level 1 Bleaching Alert Level 2 |
Definition HotSpot <= 0 0 < HotSpot < 1 1 <= HotSpot and 0 < DHW < 4 1 <= HotSpot and 4 <= DHW < 8 1 <= HotSpot and 8 <= DHW |
At Bleaching Alert Level 1, significant bleaching is expected within a few weeks of the alert. At Bleaching Alert Level 2 and above, widespread bleaching and significant coral mortality are likely. Red dashed lines across the graphs indicate DHW threshold values of 4- and 8-degree Celsius-weeks (triggers for Bleaching Alert Level 1 and 2, respectively).
Three types of information describing the long-term mean conditions about a Virtual Station site are also provided on its graph: the monthly mean climatology, the maximum monthly mean, and the bleaching threshold SST. Monthly mean SST climatologies (blue crosses) are also plotted to show "normal" SST conditions at each Virtual Station; the peak of the bleaching season typically falls during, or immediately following, the warmest months of the climatology. The time of peak bleaching varies among ocean basins and hemispheres. Generally, for the northern Atlantic Ocean and northern Pacific Ocean, it is July-September; for the southern Atlantic Ocean and southern Pacific Ocean, January-March. The peak season for the northern Indian Ocean is April-June and for the southern Indian Ocean, January-April.
CRW's maximum monthly mean SST (MMMSST) climatology is featured as a dashed light-blue line on the graphs. The MMMSST is the warmest of the twelve monthly mean SST climatology values. The Coral Bleaching Threshold SST (solid light-blue line) is defined as MMMSST plus one degree Celsius. The climatology, MMMSST, and Coral Bleaching Threshold SST are location-specific.
The Virtual Station time series were extracted from 50-km satellite data pixels over or adjacent to targeted reef sites and their exact locations are provided on each Virtual Station's data page. For more details on the CRW products mentioned above and others, please visit our product web page and product methodology page.
All the Virtual Stations also can be accessed using Google Earth to display CRW's Google Earth product suite.